The head and shoulders chart pattern is a well-known and easy-to-spot pattern in technical analysis that shows a baseline with three peaks, the middle peak being the highest.
The head and shoulders chart shows a bullish-to-bearish trend reversal, indicating that an upward trend is set to terminate.
Because the pattern exists in all time periods, it may be used by all traders and investors.
The formation's entry levels, stop levels, and price targets are straightforward to use due to the chart pattern's presentation of critical and easily distinguishable levels.
The head and shoulders pattern is a chart formation used in technical analysis to indicate a bullish-to-bearish trend reversal, and it is frequently utilized in stock, forex, and cryptocurrency speculation.
In layman's terms, the head and shoulders top pattern implies that a bullish phase or upward price trend in stock prices is likely to invert, and prices may begin to fall again, entering a bearish phase or downward price trend.
Technical analysis is a strategy used by investors to uncover profitable trading opportunities by analyzing past price and volume data displayed on charts to determine if any patterns hint that prices are going to climb or decrease, indicating a good opportunity to buy or sell.
Chart formations or price patterns emerge when prior price data or another metric, such as volume or the number of trades, is displayed on charts.
Technical analysts seek to locate and identify these patterns and formations by evaluating previous price movements in order to forecast what prices will do next.
There are several well-known chart patterns in addition to those that a trader might recognize on their own. Chart formation refers to any pattern on a chart that has the capacity to predict future price movements.
Although each pattern is only an indicator and a subjective interpretation of an individual's point of view for conjecture.
Finally, the head and shoulders pattern is recognized as one of the most reliable chart shapes due to its lengthy history among analysts.
Its inverse, a bearish-to-bullish trend reversal, is an inverse head and shoulders pattern, which is the same as the original but reverses and signifies an upward price trend.
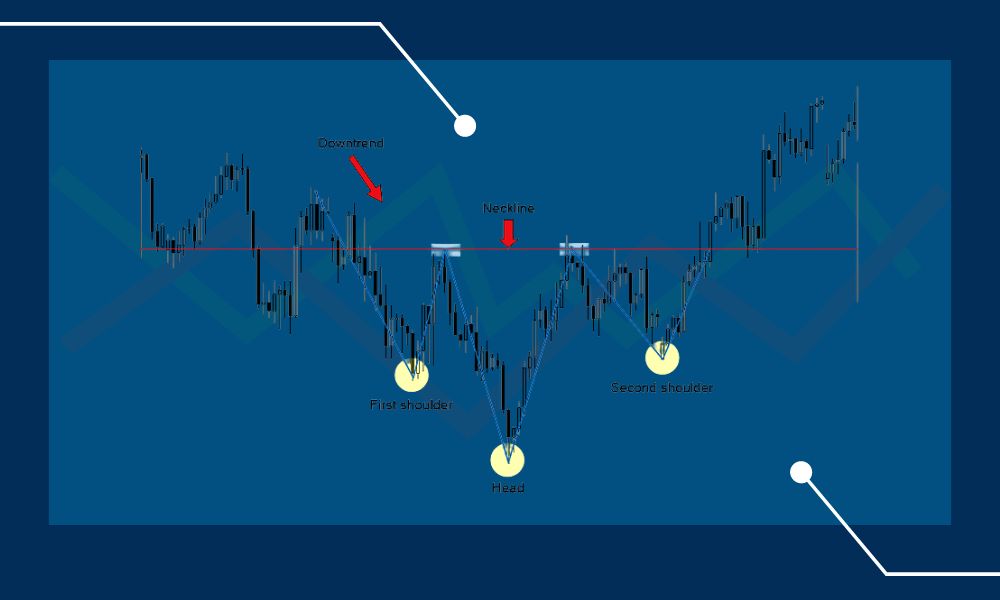
The head and shoulders pattern is formed when the price rises and concludes with a price retreat (lower), resulting in the left shoulder. This pattern happens only when the price is rising.
When the price rises again, a higher peak, known as the peak of the head, is generated. Price falls once more before rising to a lower high and forming the right shoulder.
When the price falls after the left shoulder and the head, it reaches a swing low. By connecting the swing lows with an extended trendline to the right, a "neckline" is formed.
When the price falls below the neckline, the pattern is considered complete, and the risk of additional downward movement increases.
There are various variations of the head and shoulders chart pattern, many of which are identical yet indicate different price movements.
The same structure is inverted in the reverse head and shoulders design. When higher lows occur, it indicates a bearish-to-bullish trend, reversing a negative trend.
In general, the traditional head and shoulders pattern suggests that increasing prices are likely to begin decreasing, whereas the inverse formation indicates that falling prices are poised to rise again.
The inverse head and shoulders chart pattern is used in stock and trading analysis to uncover price logic and trends.
Traders can also forecast price increases by drawing a neckline between the shoulders and the head (the two peaks between the low points).
Complex heads and shoulders have more components than simple or inverted heads and shoulders. The head is flanked by two shoulders.
It also makes the trend more difficult to detect and longer to reverse. Although more difficult to detect, this pattern can forecast price fluctuations.
The trend reversal may fail even if the head and shoulders chart pattern maintains. Price may fail to follow the trend shift, and the previous trend may reappear.
The price should not return above the neckline after it has been breached. It denotes a mild trend reversal.
The head and shoulders pattern is useful for traders because it allows them to estimate price targets and set stop-loss orders more easily.
Once the pattern has been completed and the neckline has been broken, traders can set profit and price targets.
A stop-loss order is used to limit losses by placing an order with a broker when a stock reaches a specific price. For example, if an investor buys a stock for $40 and it drops by more than 10%, the maximum loss is 10%.
To utilize the head-and-shoulders pattern to decide whether to enter or exit a trade, you must wait until the pattern is complete, since it may not continue to develop.
Even though it is useful to observe partially or almost totally developed patterns, no trades should be done until a whole pattern has been completed.
Stops are put below the low price at the head's peak in an inverse trend, whereas stops are placed above the high price at the head's peak in a peaking head and shoulders pattern.
Head and shoulders patterns may be found in all markets, including forex trading, and they are traded in the same manner.
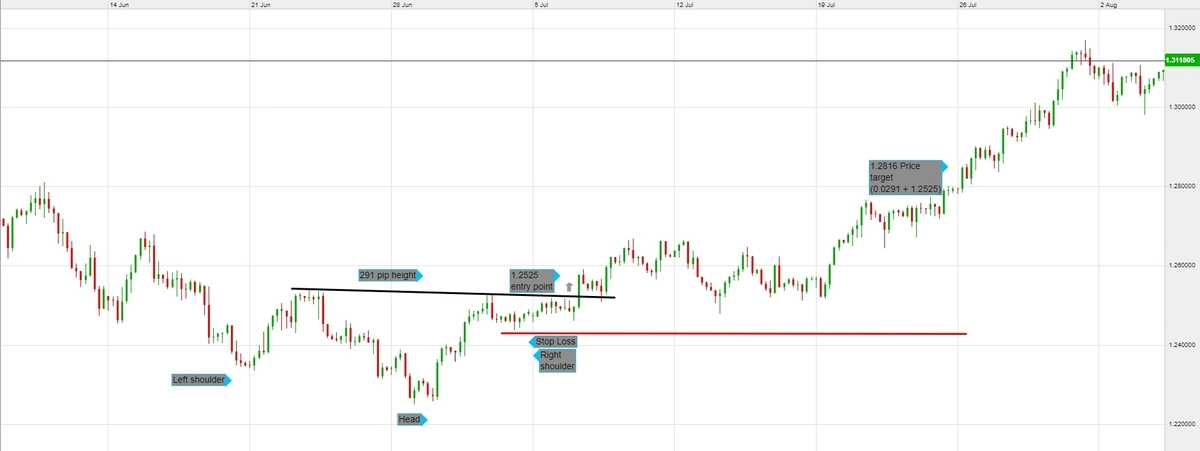
The following example employs the important currency pair GBP/USD, with entry, stop loss, and profit goal options indicated utilizing our online trading platform.
An uptrend in stocks has three peaks, with the middle peak being the highest. Set a stop loss and wait for the price to fall below the neckline before selling or shorting.
To reduce loss, place the stop loss above any swing high preceding the neckline breakout rather than above the right shoulder.
Subtract the pattern height from the breakout point to arrive at a profit target. Apple stock chart with a pattern height of 21.09.
To buy Macy's stock, traders should look for an inverse head and shoulders pattern. Learn about stock chart patterns.
To avoid common financial missteps, remember that there are several options for trends and patterns in technical analysis, and they do not always materialize perfectly.
Despite the fact that no chart pattern is always 100% accurate in signaling a trend change, the head and shoulders pattern has traditionally proven reliable and easy to recognize, as well as a valuable predictor of winning trades.
Hot Topics
The Psychology Of Trading: How Negative Feelings Can Ruin Your Trades
Essential Factors In Trading Psychology